Search Knowledge Base by Keyword
-
Introduction
-
Fundamentals
-
Favorites
-
Dashboards
-
Attachments
-
Reports
-
- Available Reports
- All Asset Types
- Application Certification Status
- Application Discovery
- Application Group Analysis
- App Group to SCCM Collection Analysis
- Application Install Count
- Application License Management
- Application Usage
- Asset Count by Property
- Asset Links Count by Asset Type
- Build Sheet
- Computer User Assignment
- Migration Readiness (Basic)
- Migration Readiness (Complex)
- O365 License Management
- O365 Migration Readiness
- SCCM OSD Status
- Scheduled Computers by Wave
- Scheduled Users by Manager
- User Migration Readiness
- VIP Users
- Wave & Task Details
- Wave Group
- Windows 10 Applications
- Patch Summary
- Delegate Relationships
- Show all articles ( 12 ) Collapse Articles
-
Self Service
-
Workflow
-
Assets
-
- View Asset
- Asset Properties
- Images
- Notes
- Waves
- Tasks
- Attachments
- History
- Rationalization
- QR Code
- Linked Assets
- SCCM Add/Remove Programs
- Altiris Add/Remove Programs
- Related Assets
- Relationship Chart
- Permissions
- Show all articles ( 1 ) Collapse Articles
-
Event Logs
-
Users & Groups
-
Asset Types
-
Charts & Dashboards
-
Options
-
Module Settings
-
API & Stored Procedures
-
Administration
Gantt Chart
< Back
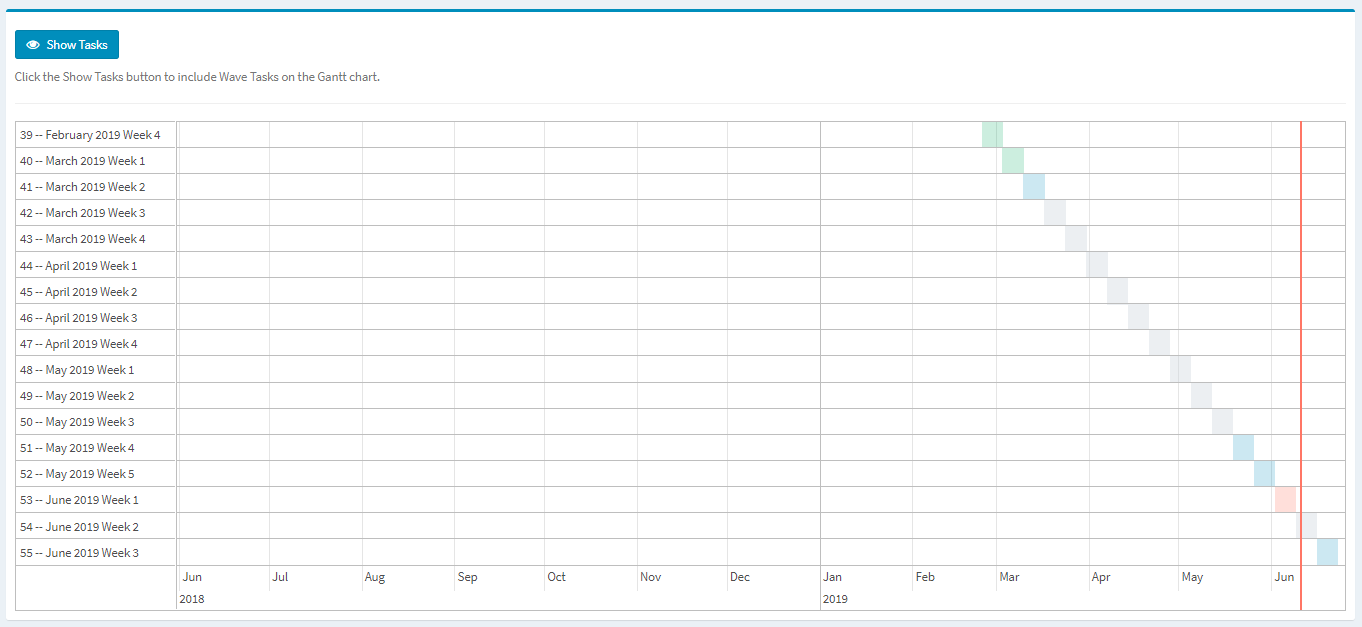
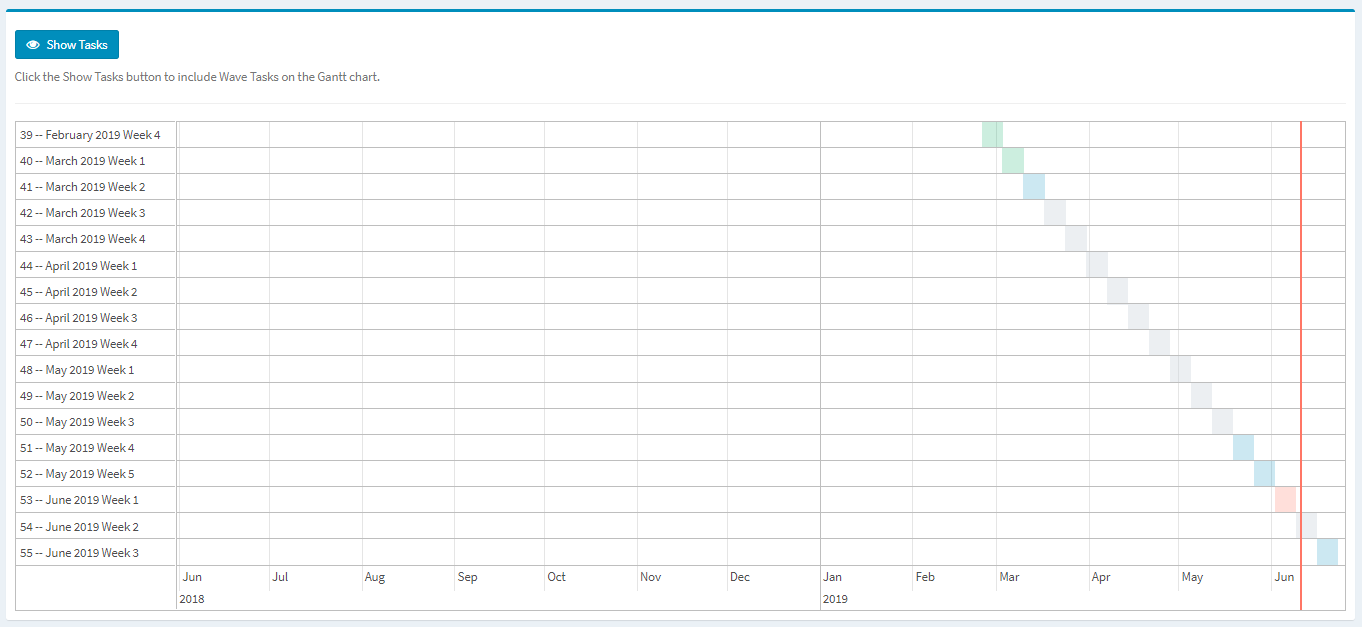
The Gantt Chart page provides a view of all migration waves and tasks visually on a Gantt chart.

Available operations:
- View waves only on a Gant chart
- View waves and tasks on a Gant chart
- Scroll across or zoom in on the timeline
- Navigate to a task by double clicking on the task
Navigation Basics

Available operations:
- Scrolling – Move through the Gantt chart by click the chart (highlighting it in blue
 ) and dragging it left or right with your mouse
 - Zooming – Zoom in or out of the Gantt chart by clicking the chart (highlighting it in blue
 ) and moving the scroll wheel on your mouse forward (zoom in) or backward (zoom out)
 - Pagination – Contols to select the number of items per page and the page number viewed are available when you have a large number or waves

Show Tasks
The default view of the Gant chart is with tasks hidden. To view tasks on the Gant chart, click the Show Tasks button. This will toggle the button to Hide Tasks.

Hide Tasks
To hide tasks on the Gant chart (when in show tasks mode), click the Hide Tasks button. This will toggle the button to Show Tasks.

